ECONOMIC ACCOUNTS
Ocean Accounts goes beyond GDP and traditional monetary accounting systems.
Ocean accounts integrate four key components(GOAP 2022):
- Macro-economic accounts from which economic measures such as GDP are derived, and from which legal, illegal, unreported, and unregulated activities can be accounted for.
- Environmental-economic accounts that explain assets and flows, wastes, expenditures, taxes, and subsidies.
- Ecosystem accounts which agree on a spatial framework or the extent, condition, biodiversity, services, and value of ecosystems.
- Structured data on ocean beneficiaries, technology, governance, and management.
A key aspect of ecosystem accounting is that it allows the contributions of ecosystems to society to be expressed in monetary terms so those contributions to society’s well-being can be more easily compared to other goods and services we are more familiar with. Monetary estimates can provide information for decision-makers, for example for economic policy planning, cost-benefit analysis, and for raising awareness of the relative importance of nature to society. Ecosystem service values are derived by using a range of economic valuation techniques (SEEA_EA 2022).
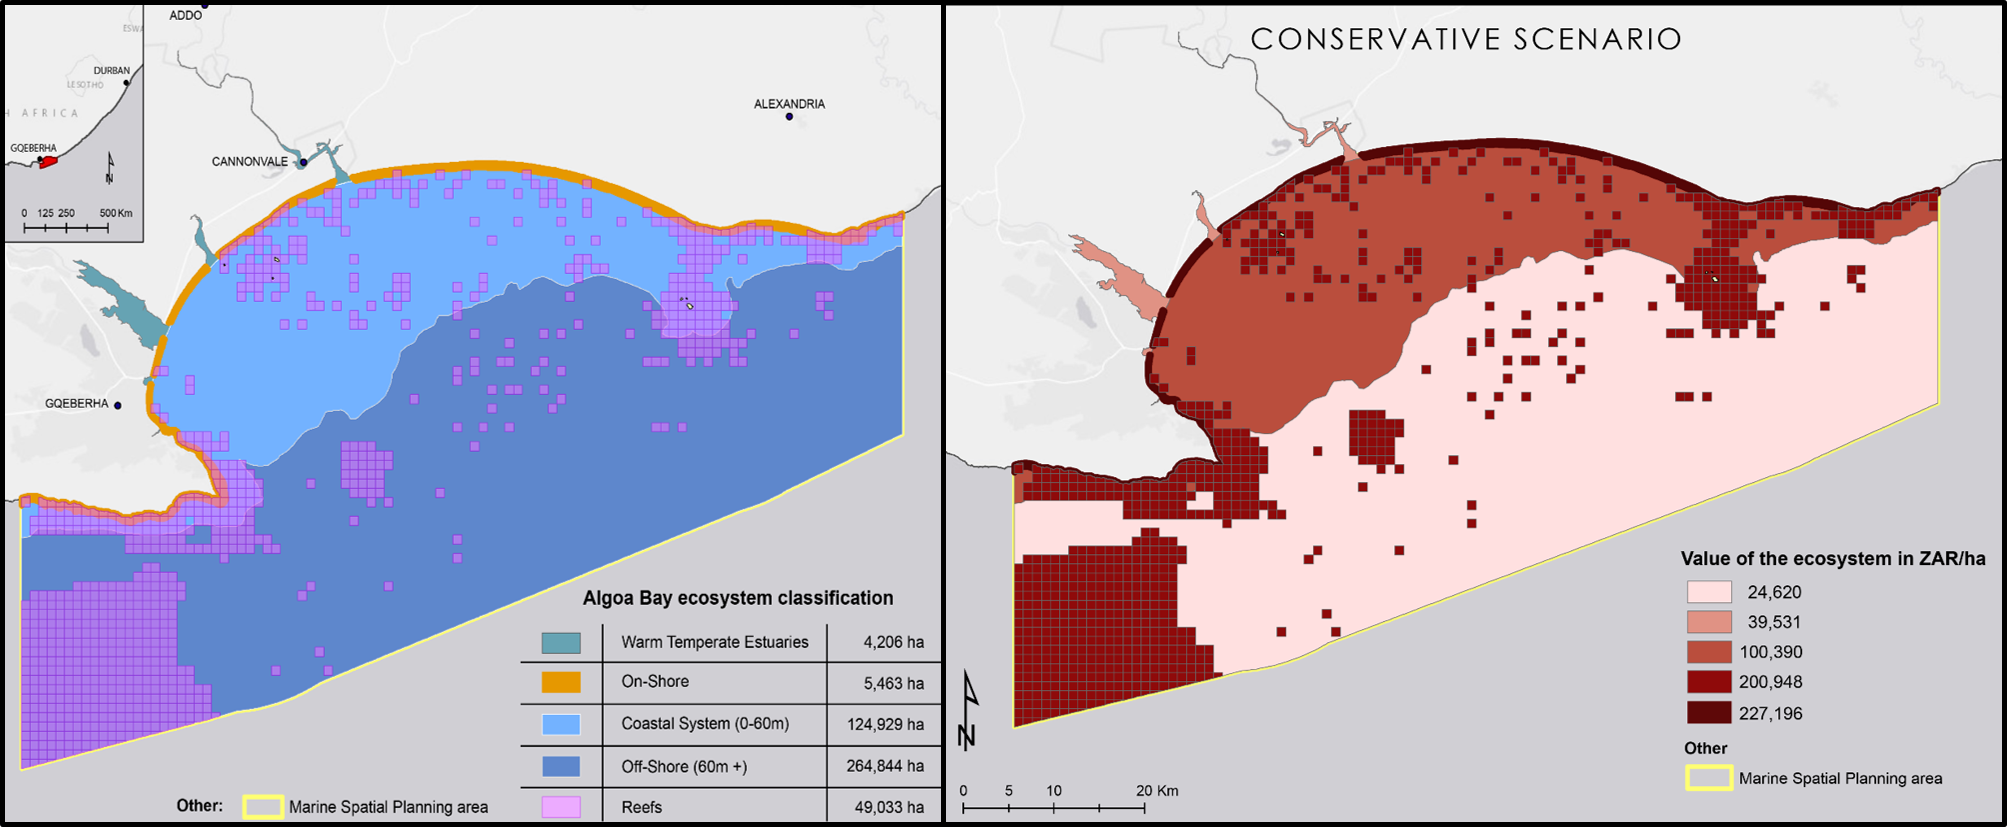
Below is a spatial representation of an ecosystem based valuation of ecosystem services at a bay scale led by The Algoa Bay Project, the Marine Spatial Planning Group and actioned and authored by Asset Research in Algoa Bay. The economic value of aggregated ecosystem types represented below are a lower-bound estimate and by no means represent the absolute value of all ecosystems present in the bay, however, give insight into how to begin to understand the connection between nature and economics. All data, methodologies and additional outputs from this work can be queried by contacting the authors directly (https://assetresearch.org.za/).
While this is not a complete account in the strictest definition, it is a starting point for how to start tracking change and associated value over time.
| The model starts with identifying an ecosystem asset, in this case, a conglomerate of marine ecosystem types classified as a ‘coastal system’, that can be measured by its extent (e.g. hectares). | This coastal system asset can be further described in terms of its condition, through indicators that reflect its overall quality (condition indicators still under review, but e.g. as a cummulative pressure or as a measure of state through SST, DO, Chl-a for example). | The air quality regulation, climate remediation, nutrient cycling, and water cycling are just a few services provided by the coastal system. | The benefits generated by the coastal system take the form of food provisioning, recreation and tourism, spiritual and cognitive, and waste dilution to name a few. | These benefits accrue to the actors in the economy, including businesses and households that produce elements of well-being that can be measured using quantitative economic techniques. |
The maps below were created from Asset Research data in an effort to exemplify spatially explicit accounts and the myriad of ways to depict ecosystems services and contribution as well as flows to and from the ocean economy.
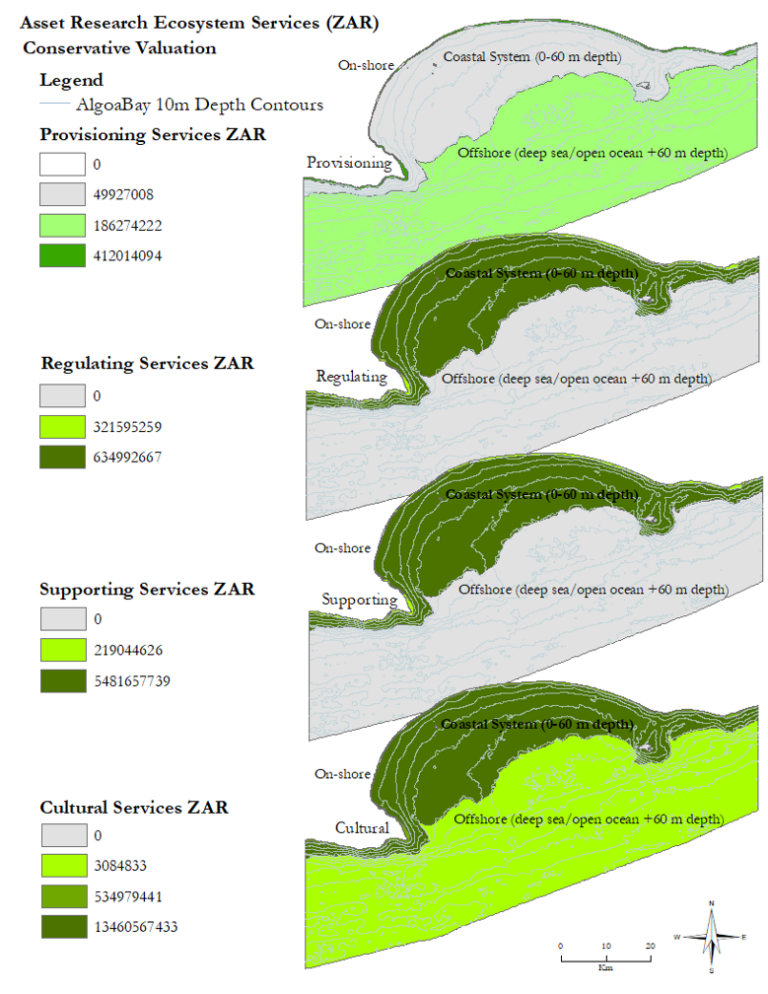
The first map shows the proportional service value in terms of ZAR according to each ecosystem category. For example, the conservative valuation shows that cultural services have the greatest proportional value in the coastal system compared to provisioning services playing a greater role in the offshore category according to this study.

Here, numerical values can be visualized in association with the ecosystem ‘type’ along with the associated service category.